Sculpted debt according to a target debt service coverage ratio (DSCR) is essential to maximizing project financing and thus equity return. While traditional debt repayment structures like an annuity or a linear repayment structure have the same or decreasing repayment profiles over a specific period, debt sculpting can be used to adjust debt repayments considering the unique cashflow profiles of any renewable energy project.
Debt Service Coverage Ratio (DSCR)
The debt service coverage ratio (DSCR) determines how much the cash flow available for debt service (CFADS) exceeds the total scheduled debt service, i.e., debt principal and interest, in any given period. Depending on the project's riskiness, i.e., the uncertainty of energy production or contractual basis of cash flows, debt financing banks are willing to give specific minimum DSCR targets for sculpted repayment structures.
DSCR (t) = CFADS (t) / Debt Service (t)
A solar PV plant in Spain with low uncertainty in energy production and a government-backed long-term remuneration scheme according to a feed-in tariff (FiT) might have a minimum DSCR target of 1.30x on a P50 basis. However, a wind farm in Finland with high uncertainty and volatility in energy production and no contractually backed cash flow offtake-agreement in place (i.e., no feed-in tariff (FiT) nor Power Purchase Agreement (PPA)) might have a minimum DSCR target of 1.70x or higher on a P90 basis.
The lower the DSCR target, the higher the potential gearing ratio (use of relative debt financing) for a given project.
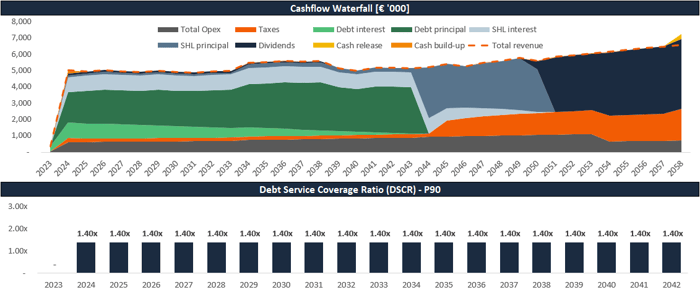
In the figure below, you can see what a cash flow waterfall according to a minimum DSCR target of 1.40x on a P90 basis may look like for a renewable energy investment.

You will encounter a circularity within your financial model when modeling a sculpted debt financing structure if the iterative calculation feature of Excel is turned off. Learn how to implement sculpted debt structures within a financial model and understand how to break such circular references in our step-by-step video course.
How to properly determine the value of an asset in a financial model for renewable energy investments?

If you're looking to invest in renewable energy, you need a comprehensive financial model dashboard that summarizes all the key investment metrics relevant to your decision-making process.
This financial model dashboard for renewable energy investments is designed to help you make informed investment decisions with ease. It includes a detailed breakdown of the project's capital structure, allowing you to understand the financing mix of the project and the risks associated with each layer of the capital stack.
The dashboard also considers critical investment metrics such as IRR and NPV on both a levered and unlevered basis, giving you a complete picture of the project's profitability.
In addition to these essential investment ratios and multiples, the dashboard details the payback periods, CFADS/EV, Revenue/EV, EV/MWp, and EV/MWh. These metrics are crucial in evaluating the financial viability of the project and determining its potential for generating returns over the long term.
The dashboard also features eye-catching charts that provide a visual representation of the project's cash flow generation over its entire asset lifetime. This feature will give you valuable insights into the project's cash flow patterns and help you make informed investment decisions.
With all these critical investment metrics and data points in one place, this financial model dashboard is the ultimate tool for renewable energy investment decision-makers.
How to build a project finance model from scratch?
Do you want to learn how to build a project finance model from scratch? Then check out the Advanced Renewable Energy Financial Modeling course.


