
Table of Contents
- Why AC vs. DC clarity matters (for finance folks)
- Power vs Energy and Duration (the bedrock)
- AC vs DC: Where Each Rating Comes From
- Frequency 101: Why the Grid Is AC While Batteries Are DC
- Effective Duration vs. Nameplate Duration: How “Headroom” Works
- Usable State of Charge (SoC Window) vs. Theoretical Capacity
- Round-Trip Efficiency (RTE) and Inverter Losses
- Availability and Curtailment: The Quiet Revenue Multipliers
- Cycles per Year (and Partial Cycling)
- Degradation & Warranties: A Lender’s Roadmap
- The Modeling Chain: From Ratings to Billable MWh
- Common Pitfalls, Final Takeaways & Next Steps
- Where to go next
- FAQs
AC vs DC in Battery Energy Storage is the single biggest source of confusion in BESS modeling. Batteries store energy on the DC side, but markets, meters, and cash flows live on the AC side—so every conversion, efficiency loss, and availability assumption directly changes the MWh that reach your revenue line.
Why AC vs. DC clarity matters (for finance folks)
For project finance, the cash register is on AC. You pay to charge (often at an AC market price) and you get paid for AC MWh delivered. If you size energy on the DC side but forecast revenue on the AC side without translating through the inverter and losses, you’ll overstate volumes and margins.
Two ratings drive the gap. MWac (power) is capped by the inverter/PCS; MWhdc (energy) comes from the cells. Developers often install more DC energy than the AC inverter can discharge at once (a higher DC:AC “overbuild”) to preserve AC output as cells age. But for revenues, MWac × duration is the ceiling per full cycle—never the DC nameplate.
Common modeling mistakes to avoid:
Mixing DC energy into AC revenue calculations.
Ignoring inverter limits, availability, or curtailment when annualizing MWh.
Misplacing round-trip efficiency (double-counting or forgetting it).
Get AC/DC straight first, and every downstream piece—cycles per year, usable SoC, degradation, augmentation, and ultimately cash flows—clicks into place.
Power vs Energy and Duration (the bedrock)
Power (MW) is a rate—the maximum instantaneous output your inverter can push to the grid. Energy (MWh) is the amount delivered over time. They’re linked by one identity that drives every BESS model:
Energy (MWh) = Power (MW) × Duration (hours)
Per-cycle ceiling: The most AC energy you can sell in one full cycle is MWa𝚌 × duration. If your inverter is 200 MWa𝚌 and duration is 2.0 h, your nameplate AC energy per cycle is 400 MWha𝚌—regardless of how much DC you installed behind it.
Changing duration changes product: Longer duration (more hours) linearly increases MWh per cycle at the same MW; higher MW at the same duration does the same. A 4-hour build with the same 200 MW inverter doubles per-cycle energy to 800 MWh.
Duration is defined on AC for revenues: Model duration = usable AC energy ÷ MWa𝚌. Treat DC energy and overbuild separately; they don’t move the AC meter without inverter capacity.
Annualization starts here: Before losses, a rough gross volume is
MWh₍gross,yr₎ = MWa𝚌 × duration × cycles per year.
(We’ll layer in round-trip efficiency, availability, curtailment, SoC window, and degradation next.)
Get these units straight upfront, and your downstream calculations—efficiency impacts, price spreads, and revenue stacking—will snap into place.
AC vs DC: Where Each Rating Comes From
Every battery has two different “faces”—the DC side where the cells live, and the AC side where the grid interacts. Getting this distinction right sits at the heart of AC vs DC in Battery Energy Storage, because investors only get paid for what shows up on the AC meter.
DC energy (MWhdc): The total rated capacity of all cells/modules. It often looks impressive on a spec sheet, but it’s not the number your revenue model should use.
AC power (MWac): Set by the inverter/PCS, it caps the maximum instantaneous output to the grid—the “faucet size” for releasing stored DC energy.
Overbuild ratio (Energy DC:AC): For BESS, think of overbuild as
(Usable DC energy at BoL) ÷ (AC nameplate energy per cycle).
Example: with a 200 MWac inverter and 2.0 h product, AC nameplate energy = 400 MWhac. A 1.3× overbuild means ~520 MWhdc sits behind the inverter. The goal: as cells degrade, there’s still enough DC to keep delivering 400 MWhac per full cycle.Terminology note: In PV, DC:AC often refers to power (kWdc/kWac). In batteries, we usually discuss energy overbuild because the commercial product is “P for T hours.”
Why finance teams care: The project only earns on MWac × duration—not on the DC nameplate. Overbuild sustains that AC product over time, but it doesn’t increase the cash register beyond the inverter’s AC rating.
The pitfall is straightforward: treating a 525 MWhdc system with a 200 MWac inverter as if it could deliver 525 MWh to the market in one cycle. It can’t. The grid and the offtaker only ever see the AC side. For accurate modeling, anchor on deliverable AC MWh, then layer in how DC overbuild preserves that delivery over time.
In short, mastering AC vs DC in Battery Energy Storage ensures your forecasts reflect reality—not inflated volumes that disappear once they hit the inverter.
Frequency 101: Why the Grid Is AC While Batteries Are DC
Electricity markets run on alternating current (AC) at a tightly controlled frequency—60 Hz in North America, 50 Hz in much of the rest of the world. That frequency is the grid’s heartbeat: when supply > demand, frequency nudges up; when demand > supply, it dips. System operators keep it near the target because everything on the grid (generators, motors, clocks, protection relays) expects that rhythm. AC also won historically because it’s easy to step voltage up and down with transformers, which made long-distance transmission efficient and safe.
Batteries, by contrast, are electrochemical devices that produce direct current (DC). Ions move one way through the electrolyte, electrons flow one way through the external circuit—so the native output is DC. Cells are wired in series/parallel to hit a target DC voltage and capacity, but they don’t “oscillate” on their own; asking a cell to alternate direction 60 times per second would simply be a short life (or a short circuit).
Enter the power conversion system (PCS)—the bi-directional inverter/rectifier that sits between the DC battery stack and the AC grid:
Charging: AC from the grid → rectifier → DC into the battery (with losses).
Discharging: DC from the battery → inverter → AC to the grid (with losses).
Control: The PCS measures grid frequency and voltage and adjusts active power (P) and reactive power (Q) accordingly. In grid-following mode, it tracks the grid waveform; in grid-forming mode, it can establish a stable AC waveform, enabling black-start/islanded operation.
For finance, this has two big implications tied directly to AC vs DC in Battery Energy Storage:
All metered revenue is on the AC side. The inverter rating (MWₐ𝚌) caps instantaneous sales, and AC-side losses/limits govern billable MWh.
Frequency services are fast, AC-measured products. BESS earns by responding within seconds (or milliseconds) to frequency deviations—injecting power when the grid sags and absorbing when it rises—paid via regulation/FFR markets. Availability and response accuracy are measured on AC, not DC.
What frequency looks like globally.
In the map below, you’ll see typical grid frequencies around the world—large 60-Hz regions (e.g., U.S., Canada, parts of Latin America and the Middle East) and widespread 50-Hz regions (Europe, most of Asia/Africa/Oceania). Some places even operate both standards in different areas (famously parts of Japan). For a project, this mainly means your PCS and interconnection must meet the local grid code, but the economic modeling still hinges on AC-metered energy and services.

Most grids operate at 50 or 60 hertz. Batteries are DC devices; the PCS converts between DC storage and AC markets, where energy and ancillary revenues are measured.”
Understanding why the grid must stay at a precise AC frequency while batteries live on DC clarifies the whole conversion chain—and why getting AC vs DC in Battery Energy Storage right is foundational before we touch cycles, efficiencies, or degradation.
Effective Duration vs. Nameplate Duration: How “Headroom” Works
What you’re looking at
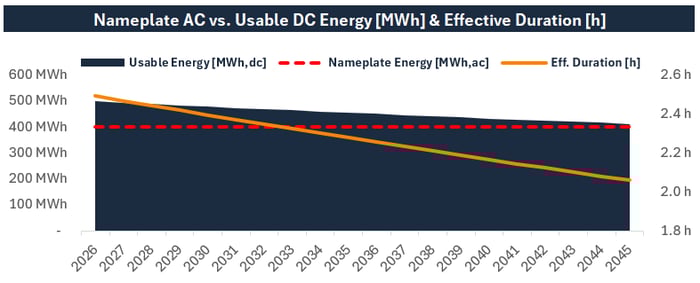
In early years, a DC-overbuilt BESS often shows effective duration that’s greater than the marketed “2-hour” product. In the chart below from our Deal Lab: BESS Project Finance Modeling course, the red dashed line is the AC nameplate energy per cycle (400 MWh = 200 MWa𝚌 × 2.0 h). The dark area is usable DC energy (converted over time), and the orange line is effective duration in hours. Notice how effective duration starts above 2 h and gradually slides down toward 2 h as cells degrade.
Define “effective duration”
Effective duration is a diagnostic, not your commercial product. It answers: “If I emptied today’s usable energy through the inverter at rated AC power, how long could I sustain that?”
Effective Duration (hours) = AC-deliverable energy this year (MWh_ac) ÷ Inverter rating (MW_ac)
In the example:
Installed/usable energy early on ≈ 525 MWh_dc
After DC→AC conversion losses, AC-deliverable per cycle ≈ 499 MWh_ac
Inverter = 200 MW_ac
Effective duration ≈ 499 / 200 = 2.49 h
This is why the orange line sits above 2 h in year one.
Why it’s above 2 h at the start
Because we oversize DC energy behind the inverter (a higher DC:AC ratio) and operate within a usable SoC window, early-life batteries have headroom beyond the marketed duration. That headroom exists to preserve the contracted product as cells degrade—not to redefine the product.
“So can I just discharge for 2.49 hours?”
Physically: Often yes—your stack has enough energy to run longer at rated MWa𝚌 in early years.
Commercially: usually not the point. Markets, interconnection limits, and many contracts define the product on the AC side as P for T hours (e.g., 200 MW for 2 h). Running longer may:
Violate or complicate contracted obligations/accreditation (e.g., a 2-hour capacity product).
Consume energy needed for the next dispatch window (two-peak systems) or ancillary commitments.
Increase cycling/DoD, affecting degradation, warranties, and augmentation timing.
In other words, effective duration tells you what’s possible, while the contract and operating strategy dictate what’s profitable and permissible. Keeping this distinction clear is central to AC vs DC in Battery Energy Storage.
How it changes over time
As usable DC energy declines, effective duration trends toward the marketed duration. Your trigger to augment is when effective duration risks dropping below the contracted standard (e.g., < 2.0 h). Augmentation restores headroom so you keep delivering the AC product reliably—another reason investors care about AC vs DC in Battery Energy Storage when reviewing long-term revenue certainty.
Modeling tips
Anchor revenues on AC nameplate (MWa𝚌 × contracted duration); treat effective duration as a feasibility check and augmentation timer.
Keep DC energy, inverter limits, efficiencies, and SoC explicit so headroom and its decline are transparent.
Track headroom vs AC nameplate as a KPI; when it nears zero, evaluate augmentation capex vs. lost revenues/penalties.
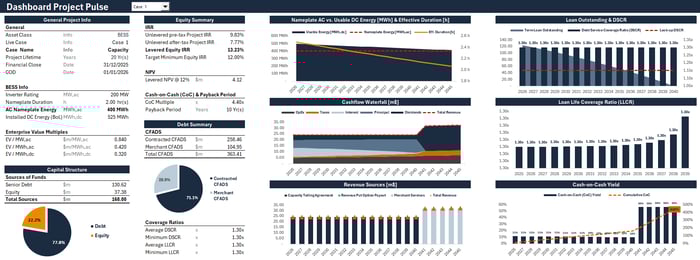
This dashboard is taken directly from our Deal Lab: BESS Project Finance Modeling – Project Pulse course. In the course, we walk step-by-step through building a fully dynamic financial model for a battery storage project, including power and energy capacity, effective duration, degradation, and the complete debt and equity cash flow structure. By the end, you’ll not only understand concepts like effective duration and headroom, but also see how they translate into IRR, DSCR, LLCR, and ultimately investment decisions.
Usable State of Charge (SoC Window) vs. Theoretical Capacity
What “theoretical capacity” really means
In the context of AC vs DC in Battery Energy Storage, the battery’s theoretical (nameplate) capacity is the total energy the cells could store on the DC side at the factory rating. It’s a lab number, not a commercial one. In real operation, we purposely don’t use the full 0–100% state-of-charge range, so the energy you can count on in your model is lower than the DC nameplate.
Why you don’t cycle 0–100%
Running from empty to full every time shortens life and risks warranty breaches. Operators keep a SoC window for:
Lifetime & warranties: Deeper cycles accelerate degradation; most warranties assume a specific Depth of Discharge (DoD) and limit full-range cycling.
Thermal & safety margins: Buffers protect the cells in hot/cold conditions and during high-power events.
Operations & grid services: You often need headroom to absorb or inject power (e.g., frequency regulation), so you can’t camp at 0% or 100%.
BMS accuracy: The battery management system needs reserve to maintain voltage/coulomb counting and avoid hard cutoffs.
Define the “usable SoC window”
Your usable SoC window is the portion of the DC nameplate you plan to use routinely.
Examples:
10%–90% SoC ⇒ 80% usable window
5%–100% SoC ⇒ 95% usable window (common when preserving a 2-hour product with DC overbuild)
Usable DC energy per cycle (MWh_dc) = Installed DC energy (MWh_dc) × Usable SoC window (%)
From SoC window to AC-deliverable MWh
To reach the revenue meter, you still pass through the PCS and wiring—this conversion chain is core to AC vs DC in Battery Energy Storage.
AC-deliverable energy per cycle (MWh_ac)
= Usable DC energy per cycle (MWh_dc) × Discharge-path efficiency (%)
Worked intuition (aligned with our Deal Lab case):
Installed DC energy at BoL ≈ 525 MWh_dc
Usable SoC window ≈ 95% ⇒ ~499 MWh_dc usable
After DC→AC conversion losses, ~499 MWh_ac available (early life, simplified)
With a 200 MW_ac inverter, effective duration ≈ 499 / 200 ≈ 2.49 hours
DoD vs. cycle life: the trade-off you price in
Depth of Discharge (DoD) = fraction of capacity used per cycle.
Higher DoD → fewer lifetime cycles (faster wear); lower DoD → more cycles (slower wear).
In modeling, aggregate mixed partial cycles into Equivalent Full Cycles (EFCs) so your degradation and warranty math stays consistent.
Warranties typically promise a minimum capacity after X years or Y EFCs at a stated DoD and temperature profile. Your SoC window should respect this.
How to choose the window in a project
Start from the warranty spec (DoD, cycles, temperature ranges).
Layer your use case: arbitrage may tolerate a wider window early on; heavy regulation/FFR often needs symmetric headroom to go up/down quickly.
Consider augmentation timing: a wider window today may pull forward augmentation capex; a tighter window preserves life but might leave revenue on the table.
Ensure the window keeps your AC product deliverable (e.g., 200 MW for 2 hours) across the contract term—this is where DC overbuild and effective duration planning matter.
Modeling tips (copy-paste checklist)
Keep DC nameplate, usable SoC window, and AC-side energy as separate lines—never mix them.
Drive revenue MWh from AC-deliverable energy; use SoC window only to derive usable DC.
Track EFCs and apply your degradation curve to usable DC each year; re-compute effective duration and flag when augmentation is required.
Frame all of the above within AC vs DC in Battery Energy Storage so readers see a clean map from cell energy to metered cash flows.
Round-Trip Efficiency (RTE) and Inverter Losses
Quick refresher: what the inverter does
In AC vs DC in Battery Energy Storage, the power conversion system (PCS) is the translator:
Charge path: AC from the grid → rectifier → DC into the cells.
Discharge path: DC from the cells → inverter → AC to the grid.
It also synchronizes to grid frequency, controls P/Q, and enforces your MWac cap. Each conversion has losses, which is why not every charged MWh returns as a billable MWh.
Finance shorthand for round-trip efficiency:
RTE (η_total) ≈ η_inverter(charge) × η_cell × η_inverter(discharge)
Energy sold (MWh) = Energy bought (MWh) × η_total
Energy required to sell 1 MWh = 1 ÷ η_total (e.g., at 0.81 RTE you must buy ≈ 1.23 MWh)
Why many project-finance models don’t put RTE in the revenue block
In lender-grade PF models, revenues are often based on an Independent Engineer’s AC-side, normalized price—for example $/kWac per month for a 2-hour product. That value usually already bakes in the IE’s view of spreads, dispatch, RTE, parasitic/aux loads, curtailment assumptions, and market shape (duck curve effects). If you then add another RTE haircut in the model, you double-count losses.
Said differently: lenders want you to keep a clean separation between technical accounting (how DC becomes AC) and commercial inputs (IE’s AC-based revenue factor). Revenues clear on AC, and the IE’s factor is already an AC-net figure.
Why we omit RTE from revenues in this case study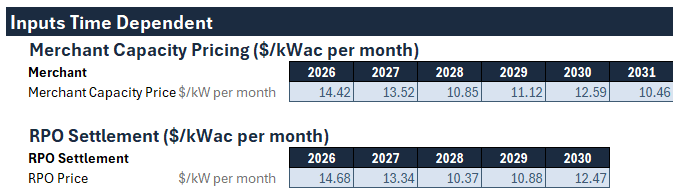
Our merchant line is provided by the IE as $/kWac per month. It’s defined on the AC meter and reflects expected operations for our 2-hour BESS, including conversion losses. To stay consistent with standard PF practice—and avoid double-counting—we use the IE rate directly for revenues.
We still track the AC vs DC mechanics in the technical block (effective duration, usable SoC, degradation/EFCs), because understanding AC vs DC in Battery Energy Storage is essential for availability, augmentation timing, and warranty compliance—but we do not apply a separate RTE haircut on top of an already net AC price.
When you must model RTE explicitly
Add RTE to the revenue/cost calc if any of the following are true:
Your merchant forecast is $/MWh or you’re building spreads from market curves yourself.
The IE gave gross prices that do not include conversion/aux losses.
You need explicit charge MWh and charge cost lines (e.g., day-ahead/real-time arbitrage analysis).
Required sell price ≥ Buy price ÷ η_total
(At 0.81 RTE and $10/MWh buy price, break-even sell ≈ $12.35/MWh before variable O&M, degradation cost per MWh, and fees.)
A short checklist to confirm with the IE
Price basis is AC (kWac) and already net of RTE/aux.
Assumed duration compliance over life (i.e., augmentation plan).
Treatment of availability/curtailment (baked in or modeled separately).
Real vs nominal and any escalation index.
Node/zone and basis assumptions.
Bottom line: for AC-normalized, IE-driven revenue inputs (like $/kWac-month), keep RTE in the technical side of the model, not in the revenue side. That preserves the integrity of your PF case, aligns with lender expectations, and keeps your story consistent with the realities of AC vs DC in Battery Energy Storage.
Availability and Curtailment: The Quiet Revenue Multipliers
Why this matters in AC vs DC in Battery Energy Storage: even with perfect DC sizing, cash flows clear on the AC meter—and two simple scalars decide how much of your theoretical energy becomes sellable MWh.
Definitions you’ll actually model
Availability (%)
Share of time the plant can deliver its contracted AC power (inverter/PCS, BMS, HVAC, EMS healthy; not in planned/forced outage). It’s an equipment readiness metric, not utilization.Curtailment (%)
Fraction of potential AC discharge the grid/operator (or interconnection limit) prevents you from delivering. You were available, but not allowed or scheduled to run.
How they hit energy and revenue
Use them as plain multipliers on AC-side volumes:
Annual AC MWh
= MW_ac × Duration (h) × Cycles/yr × Availability × (1 − Curtailment)Capacity-style revenue (e.g., $/kWac-month)
Usually scaled by availability/compliance; curtailment often doesn’t apply unless specified.Energy/ancillary revenue ($/MWh)
Scale MWh by both availability and (1 − curtailment). If your merchant input is an IE $/kWac-month already net of curtailment, don’t double-count—confirm the basis.
Practical notes
Model availability on the AC side (it reflects PCS, transformer, HVAC, controls)—consistent with AC vs DC in Battery Energy Storage.
Keep price and quantity separate: curtailment trims quantity; negative/zero prices trim value.
Track reasons separately (forced vs planned, market vs interconnection) to defend assumptions with lenders.
Small percentages move big dollars. A 97% availability and 1% curtailment silently remove ~4% of your theoretical AC energy—before any efficiency or market effects—another reason to keep AC vs DC in Battery Energy Storage cleanly separated in your model.
Cycles per Year (and Partial Cycling)
Why it matters in AC vs DC in Battery Energy Storage: cycles turn your installed capacity into throughput and wear. Revenues may price the AC product, but degradation is driven by energy moved, so you need a clean bridge between AC MWh and DC throughput.
The convention
Many models assume ~1 full cycle/day ⇒ ~365 cycles/year for a 2-hour arbitrage battery. Reality varies by market, contract, and dispatch.
Handling partial cycles
In AC vs DC in Battery Energy Storage, the clean way to add up lots of shallow moves is to convert them into Equivalent Full Cycles (EFCs)—how many “full” cycles the battery effectively performed over the year.
Finance-simple approach:
EFC equals the total AC megawatt-hours sold in the year divided by inverter rating in MWac times contracted duration in hours. In words: “annual AC MWh divided by MWac × hours.”Life-accurate approach (preferred for degradation):
EFC equals the total DC discharge throughput in the year divided by the usable DC energy per cycle. A practical way to estimate DC throughput is to take your total AC MWh sold and divide by the discharge-path efficiency (because the inverter and wiring drop some energy on the way out).
Using EFCs lets you compare a year with many shallow up/down moves to a year with a few deep cycles on equal footing, and it keeps the bridge between AC vs DC in Battery Energy Storage crystal clear: revenues are counted on the AC side, while wear and warranties are driven by DC energy moved.
Strategy depends on use case
Arbitrage: Typically one deep evening cycle, maybe a second shoulder cycle. Fewer, deeper cycles; spreads must beat the RTE-adjusted threshold.
Regulation/FFR: Many shallow, rapid moves; AC MWh may look modest but EFCs pile up, pulling forward degradation/augmentation. Contracts often pay for performance and speed more than MWh.
Modeling notes
Keep cycles/EFCs separate from availability; don’t conflate being online with actually cycling.
Drive degradation from EFCs (DC view) and drive energy revenue from AC MWh—a clean separation that keeps AC vs DC in Battery Energy Storage consistent.
If revenue is $/kWac-month, cycles affect compliance and life, not the price; if it’s $/MWh, cycles directly scale volumes.
Degradation & Warranties: A Lender’s Roadmap
What actually degrades—and why
Two forces shrink usable capacity over time:
Calendar fade: aging from time, temperature, and storage at high SoC (even with few cycles).
Cycle-driven fade: wear from charging/discharging. It rises with Depth of Discharge (DoD), C-rate (power vs energy), and temperature.
Track cycling with Equivalent Full Cycles (EFCs) so your life model matches dispatch.
What the warranty really promises
Most warranties define performance on the DC side but must be honored on the AC product:
Minimum usable capacity (e.g., ≥70–80% of initial at year X or Y EFCs, under stated DoD/temperature).
Minimum round-trip efficiency and an allowed operating window (SoC, C-rate, ambient conditions).
Testing & remedies: periodic capacity/duration tests; if you fall short, you augment or accept remedies/derates.
Keeping the bridge clear in AC vs DC in Battery Energy Storage helps you translate these DC promises into AC deliverability.
How degradation shows up in your AC product
As usable DC energy declines, effective duration slides toward your contracted duration. Early-life overbuild provides headroom; over time, that headroom shrinks. Lenders focus on one question: Can you still deliver P for T hours on the AC meter every year of the deal? That’s why AC vs DC in Battery Energy Storage is central to covenant tests and lender comfort.
Augmentation: when and how
Trigger: when modeled effective duration approaches the contract threshold or when capacity falls below the warranty minimum.
What you do: add/swap DC modules (PCS/transformer usually unchanged), restore headroom, re-test.
How to book it:
Plan as Capex in specific years (preferred for debt sizing), or
Accrue an Opex reserve that funds future augments.
Include installation costs, margin, and a contingency; update degradation curves post-augment.
Modeling checklist (quick and practical)
Inputs: calendar fade %, cycle-life curve vs DoD/EFCs, warranty minimums (capacity & efficiency), augmentation unit costs ($/kWh added), test cadence.
Annual steps: compute EFCs → update usable DC → recompute effective duration → check triggers → schedule augmentation capex/reserve → re-test compliance.
Show lender KPIs: duration compliance, capacity test results, DSCR impact of augmentation capex.
Keep it simple: degrade on DC, prove deliverability on AC, and pre-plan augmentation. That’s the path to a bankable story.
The Modeling Chain: From Ratings to Billable MWh
Here’s the copy-paste mental model that keeps AC vs DC in Battery Energy Storage clean and consistent.
1) Base AC volume (what the meter can see)
Use this when the inverter (AC) is the binding limit—typical for a 2-hour build with DC headroom.
Annual AC MWh
= MW_ac × Duration (hours) × Cycles per year × Availability × (1 − Curtailment)
If degradation makes DC the limiter, replace “Duration” with Effective Duration (the smaller of the two).
2) Charge energy (only if you’re pricing energy trades)
When you need to know how much energy must be purchased/charged:
AC charge MWh
= (Annual AC MWh sold) ÷ RTE_total
(Keep RTE out of revenue if your forecast is an IE $/kWac-month that already nets losses.)
Worked examples
Assumptions for both: 200 MW_ac inverter, 2.0-hour product, 365 cycles/year, 97% availability, 1% curtailment. RTE_total = 81% where used.
A) Per-day (AC-limited, early life)
AC MWh sold/day: 200 × 2.0 × 0.97 × 0.99 ≈ 384.12 MWh
AC charge MWh/day (if pricing energy): 384.12 ÷ 0.81 ≈ 474.22 MWh
B) Per-year (AC-limited, early life)
Annual AC MWh sold: 200 × 2.0 × 365 × 0.97 × 0.99 ≈ 140,204 MWh (~140 GWh)
Annual AC charge MWh: 140,204 ÷ 0.81 ≈ 173,091 MWh (~173 GWh)
C) Late-life DC-limited snapshot (effective duration slips to 1.95 h)
Annual AC MWh sold: 200 × 1.95 × 365 × 0.97 × 0.99 ≈ 136,699 MWh (~137 GWh)
→ This is your augmentation trigger if a contract requires 2.0 hours.
What to remember
The AC meter determines billable MWh; RTE mainly tells you how much charge energy you must buy to achieve those AC sales.
When your merchant input is an IE $/kWac-month, treat it as AC-net and don’t apply an extra RTE haircut.
Keeping these steps separate preserves the logic of AC vs DC in Battery Energy Storage and makes the model lender-clean.
Common Pitfalls, Final Takeaways & Next Steps
If you remember one thing from AC vs DC in Battery Energy Storage, make it this: revenues clear on the AC meter; everything else is a conversion or constraint on the path to that meter.
Pitfalls to avoid (quick checklist)
Mixing AC and DC ratings in the same formula.
Using DC nameplate instead of usable capacity or effective duration.
Forgetting availability and curtailment when annualizing MWh.
Treating RTE incorrectly (e.g., double-counting or applying it to both buy and sell sides when prices are already AC-net).
Ignoring partial cycles/DoD when forecasting degradation and augmentation.
Where to go next
To turn this framework into a working, lender-clean model, dive into Deal Lab: BESS Project Finance Modeling — Project Pulse. In that course we build the end-to-end model used throughout this article (effective duration, headroom, augmentation, DSCR/LLCR, cash waterfalls).
Deal Lab is part of the Renewables Valuation Certification (RVA Certification) — a structured, multi-course program designed to take you from fundamentals to professional-grade valuation and project finance modeling across renewables and storage. The curriculum focuses on market mechanics, revenue stacking, debt sizing, covenant testing, and investment decisions, culminating in practical case work and a portfolio-ready capstone.
 Note: This Deal Lab course is offered exclusively to students enrolled in the RVA Certification program.
Mastering the bridge between AC and DC in battery energy storage is the key to turning technical complexity into clear, confident project finance decisions.
FAQs
What’s the difference between AC vs DC in Battery Energy Storage, and which rating should I use in a financial model?
Short answer:
DC (MWhdc): Energy stored in the cells. Use it to track usable SoC, degradation, EFCs, and augmentation.
AC (MWac / MWhac): What the inverter can deliver to the grid. Use it to calculate billable energy and revenues.
How to think about it:
Per-cycle AC energy:
MWhac_per_cycle = MWac × duration (h)Effective duration (check):
Effective duration = AC-deliverable energy this year (MWhac) ÷ MWacOverbuild: Extra DC behind the inverter gives early-life headroom so you can still deliver the AC product as cells fade.
Which one drives revenue?
Revenue clears on the AC meter. Model annual MWh using AC terms (and availability/curtailment). Only bring RTE into the calc if you price energy trades in $/MWh; if your merchant input is an IE $/kWac-month already net of losses, don’t apply an extra RTE haircut.
Example:
A 200 MWac, 2-hour BESS sells up to 400 MWhac per full cycle. With ~525 MWhdc installed, early life shows ~2.49 h effective duration—useful headroom, but the market still buys an AC product: 200 MW for 2 h.
My model shows effective duration > nameplate (e.g., 2.49 h vs a 2-hour product). Can I just sell more?
Short answer:
You often can run longer physically early in life, but your commercial product is still defined on the AC side (e.g., 200 MW for 2 h). Effective duration > 2 h is headroom created by DC overbuild—it’s there to preserve the AC product as the cells degrade, not to expand it.
How to think about it:
Effective duration (hours) = AC-deliverable energy this year (MWh_ac) ÷ Inverter rating (MW_ac).
Early life: usable DC energy is high, so AC-deliverable energy per cycle is > (MW_ac × 2 h). That’s why the ratio can be ~2.49 h.
Over time: usable DC declines → effective duration slides toward 2.0 h. When it risks dropping below 2.0 h, you augment.
Commercial reality:
Contracts, accreditation, and interconnection usually buy an AC product with fixed hours.
Using extra headroom today may steal energy from later dispatch windows or increase wear (higher DoD/EFCs).
Lenders judge deliverability on AC: “Can you meet P for T every year?”—which is why AC vs DC in Battery Energy Storage matters so much.
Example:
200 MW_ac × 2 h = 400 MWh_ac per cycle (contracted). With ~525 MWh_dc installed and a 95% usable window, early-life AC-deliverable energy might be ~499 MWh_ac → 499 ÷ 200 ≈ 2.49 h effective duration. That extra 0.49 h is insurance, not new product.
Do I need to model round-trip efficiency (RTE) in my revenue stack?
Short answer:
It depends on how your merchant revenue is defined. If your forecast is an IE-provided $/kWac-month (AC-normalized) figure, it typically already nets RTE and aux losses—so don’t apply another RTE haircut or you’ll double-count. If your revenue is $/MWh (you’re building spreads from prices), then yes, model RTE explicitly.
How to decide (quick checklist):
Is the price on AC (kWac) and stated as net of losses?
Does it assume you can deliver P for T over life (i.e., includes augmentation)?
Are availability/curtailment baked in or modeled separately?
If the answers point to an AC-net IE number, keep RTE out of the revenue line.
If you must model it (energy-settled cases):
AC MWh sold = MWac × duration × cycles × availability × (1 − curtailment)
AC charge MWh = AC MWh sold ÷ RTE_total
Break-even sell price ≥ Buy price ÷ RTE_total
Example: RTE = 0.85, buy = $35/MWh → sell ≥ $41.18/MWh before O&M and fees.
Why this fits AC vs DC in Battery Energy Storage:
RTE lives in the conversion chain from DC to AC; revenues clear on the AC meter. Use RTE where you price energy trades, not on top of AC-normalized $/kWac-month inputs.
How much DC overbuild do I need to meet a 2-hour product over life?
Short answer:
Size DC so that even in your worst pre-augmentation year the system can still deliver the AC product (P for T hours). For many 2-hour systems this yields an energy DC:AC ratio around 1.25×–1.40×, but the exact number depends on usable SoC, discharge efficiency, expected degradation, temperature, and cycling. This is a core design choice in AC vs DC in Battery Energy Storage.
A simple framework:
Required AC energy per cycle = MWac × duration.
Convert to required usable DC at the end of the target year:
usable_DC_required = AC_energy / discharge_efficiency.Back out the BoL usable DC with your degradation forecast:
BoL_usable_DC = usable_DC_required / (1 − lifetime_degradation_fraction).Convert BoL usable DC to installed DC with your SoC window:
installed_DC = BoL_usable_DC / usable_SoC_fraction.Overbuild ratio (energy) = installed_DC / AC_energy_per_cycle.
Worked example (matches the 200 MWac, 2-hour case):
AC product = 200 MW × 2 h = 400 MWhac.
Discharge efficiency ≈ 95% → usable_DC_required ≈ 400 / 0.95 = 421 MWhdc.
Expect 15% usable-DC loss by Year N → BoL_usable_DC ≈ 421 / 0.85 = 495 MWhdc.
Usable SoC window 95% → installed_DC ≈ 495 / 0.95 = 521 MWhdc.
DC:AC energy ratio ≈ 521 / 400 = 1.30×.
This is why a ~525 MWhdc stack behind a 200 MWac inverter is a common design for a 2-hour product.
Trade-offs:
More overbuild now = higher upfront capex, slower early degradation felt at the AC meter.
Less overbuild + planned augmentation = lower BoL capex, but future capex hits and operational downtime.
Pick the path that maximizes NPV within your warranty and financing constraints—keeping the mapping between AC vs DC in Battery Energy Storage explicit so lenders can follow your logic.
Is duration defined on AC or DC, and how is it tested?
Short answer:
Duration is an AC-side concept. Lenders and operators verify it by discharging at the rated MWac and confirming that the metered AC energy meets or exceeds MWac × contracted hours. DC capacity provides headroom to make this possible, but the test itself is passed or failed on the AC meter—a core reason why AC vs DC in Battery Energy Storage matters.
How a duration test typically works (simplified):
Pre-condition the battery (temperature, SoC window) per the procedure.
Set the AC discharge to the accredited power (e.g., 200 MWac).
Hold that output continuously until you hit the stop condition.
Read the AC meter: energy delivered must be ≥ MWac × contracted hours (e.g., ≥ 400 MWhac for a 200 MWac, 2-hour product).
Document ambient conditions, set points, and any allowed tolerances.
What DC does here:
DC overbuild, usable SoC, and discharge efficiency ensure you have enough AC-deliverable energy to pass the test through life.
As cells fade, effective duration drifts toward the contract—your signal to plan augmentation.
Modeling tip:
Track effective duration annually on the DC side, but evaluate compliance on the AC side. Schedule augmentation before modeled effective duration dips below the contract threshold. Keeping the mapping explicit between AC vs DC in Battery Energy Storage makes your compliance story lender-clean.
Why doesn’t $/kWac-month revenue multiply by duration or cycles?
Short answer:
Because $/kWac-month pays for accredited AC capacity (P), not for energy (MWh). It’s an AC-normalized, time-based payment. Duration matters only for compliance (you must be able to deliver P for T hours), not for calculating the monthly check.
How to think about it:
In AC vs DC in Battery Energy Storage, capacity-style revenue is tied to the AC meter’s deliverability test (P for T). The Independent Engineer’s $/kWac-month already reflects assumed hours, dispatch, RTE, and market shape. If you multiply that price by duration or cycles, you double count energy.
Modeling check:
Revenue per month = Price ($/kWac-month) × MWac × Availability/Performance scalars
Do not multiply by hours or MWh. Use duration only to confirm compliance; schedule augmentation if effective duration risks falling below T.
Example:
If the IE gives $8.50/kWac-month for a 200 MWac, 2-hour BESS with 97% availability, monthly revenue ≈ 8.50 × 200,000 × 0.97 = $1.649M (before any other scalars). No duration multiplier is added. Keeping this separation clean is central to AC vs DC in Battery Energy Storage and prevents overstatement of revenues.
How do I turn this into a lender-ready BESS model (AC vs DC done right)?
Short answer:
Enroll in the Renewables Valuation Certification (RVA Certification) and unlock Deal Lab: BESS Project Finance Modeling — Project Pulse (available exclusively inside RVA Certification Program). It’s the fastest way to build a full, lender-clean model with AC vs DC in Battery Energy Storage mapped correctly end-to-end.
What you’ll build in Deal Lab (Project Pulse):
AC/DC mapping, effective duration, usable SoC, availability/curtailment
Revenue stacks (capacity $/kWac-mo vs merchant energy $/kWac-mo), augmentation timing, degradation
Debt sizing with DSCR/LLCR, sensitivities, and a pro dashboard you can reuse
What the RVA Certification is:
A structured, multi-course program that takes you from fundamentals to expert-level renewable & storage project-finance modeling. You get lifetime access, real case studies, templates, and a coherent pathway from basics to bankable models—so AC vs DC in Battery Energy Storage becomes second nature.
Who it’s for:
Analysts, associates, developers, and lenders who want models that pass diligence and drive decisions.
Next step:
Join the RVA Certification to access Deal Lab: BESS Project Finance Modeling — Project Pulse and the rest of the curriculum.