The Internal Rate of Return (IRR) is a financial metric used in project finance to evaluate the profitability of an investment. It represents the discount rate at which the net present value (NPV) of the project's expected cash flows equals zero.
In project finance, the IRR is used to assess the attractiveness of an investment opportunity. Investors compare the IRR of different projects to determine which ones are most likely to generate the highest returns on their capital.
To calculate the IRR, analysts first estimate the expected cash flows from the project over its life cycle, including all inflows and outflows. These cash flows are then discounted back to their present value using a discount rate that represents the cost of capital for the project. The IRR is the rate at which the sum of the discounted cash flows equals zero.
If the IRR is higher than the required rate of return or cost of capital for the project, then the investment is considered attractive and likely to generate positive returns. Conversely, if the IRR is lower than the required rate of return, the project is considered less attractive and less likely to generate positive returns.
IRR vs. Cash on Cash Return
The IRR and the Cash on Cash (CoC) return are both financial metrics used in project finance to evaluate the profitability of an investment, but they measure different aspects of the investment.
The IRR is a measure of the annualized rate of return that an investment is expected to generate over its life cycle, based on the project's expected cash flows. It takes into account the timing and magnitude of the project's cash inflows and outflows and considers the time value of money by discounting future cash flows back to their present value. The IRR is typically used to evaluate the overall attractiveness of an investment opportunity and to compare different investment opportunities.
The CoC return, on the other hand, is a measure of the amount of cash generated by the project relative to the amount of cash invested in the project. It is calculated by dividing the annual cash flow generated by the project by the amount of cash invested in the project. The CoC return is typically used to evaluate the project's cash flow generation capacity and to assess the risk of the investment by looking at the extent to which the project generates sufficient cash to service debt and other financing obligations.
While both the IRR and the CoC return are important metrics in project finance, they measure different aspects of the investment and can provide different insights into the investment opportunity. The IRR focuses on the overall rate of return generated by the investment, while the CoC return focuses on the cash flow generation capacity of the investment. As such, the IRR is more useful for evaluating the investment's profitability and attractiveness, while the CoC return is more useful for evaluating the project's ability to generate sufficient cash flow to meet its financing obligations.
How to model the IRR in Excel?

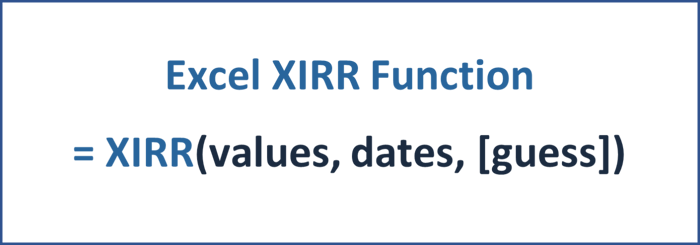
The Excel XIRR function returns the IRR for a schedule of cash flows that is not necessarily periodic. While the IRR function works well to determine the IRR for periodically annualized cashflows, the XIRR function assigns specific dates to each cash flow.
Therefore, the main benefit of using XIRR is that it can calculate a precise return for a series of cashflows that occurs unevenly. This is especially beneficial for calculating the return metrics of project financings and is used as best practice in the context of financial modeling for renewable energy investments.
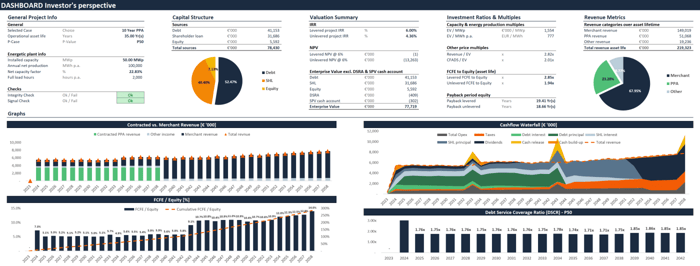
Enhance the decision-making process of your organization with a comprehensive financial model dashboard.

If you're looking to invest in renewable energy, you need a comprehensive financial model dashboard that summarizes all the key investment metrics relevant to your decision-making process.
This financial model dashboard for renewable energy investments is designed to help you make informed investment decisions with ease. It includes a detailed breakdown of the project's capital structure, allowing you to understand the financing mix of the project and the risks associated with each layer of the capital stack.
The dashboard also considers critical investment metrics such as IRR and NPV on both a levered and unlevered basis, giving you a complete picture of the project's profitability.
In addition to these essential investment ratios and multiples, the dashboard details the payback periods, CFADS/EV, Revenue/EV, EV/MWp, and EV/MWh. These metrics are crucial in evaluating the financial viability of the project and determining its potential for generating returns over the long term.
The dashboard also features eye-catching charts that provide a visual representation of the project's cash flow generation over its entire asset lifetime. This feature will give you valuable insights into the project's cash flow patterns and help you make informed investment decisions.
With all these critical investment metrics and data points in one place, this financial model dashboard is the ultimate tool for renewable energy investment decision-makers.
How to build a project finance model from scratch?
Do you want to learn how to build a project finance model from scratch? Then check out the Advanced Renewable Energy Financial Modeling course.


